Arduino + CdS
Updated: 2026-05
This article was written before 2020. It is kept here as an archive — the content is outdated and some links may no longer work.
What Is a CdS Cell?
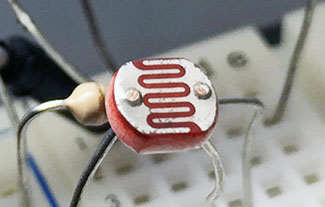
CdS (cadmium sulfide) is a material whose resistance changes depending on the amount of light it receives. A CdS cell is a resistor that utilizes this property of CdS. Since its resistance decreases as the intensity of light falling on the cell increases, it is used as a light sensor.
Implementation of CdS
Continuing from the previous lecture notes on “Arduino + Switch,” we will add the following components.
Components Used
・5mm CdS cell: 1
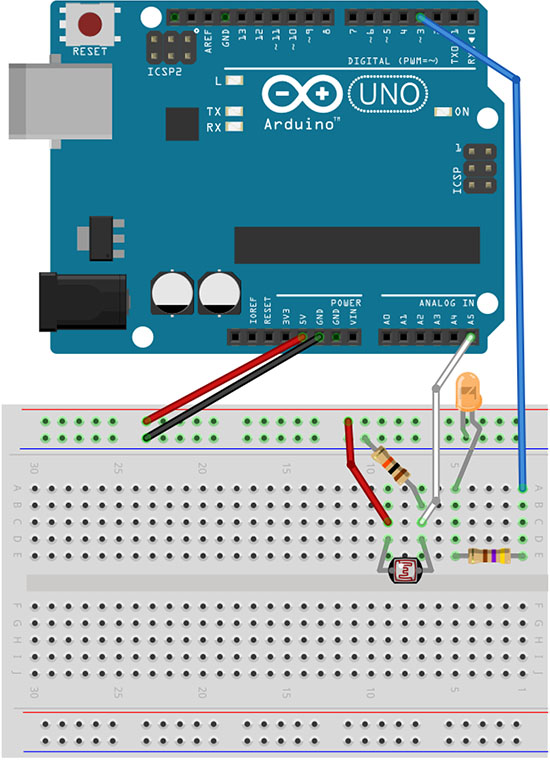
Circuit Diagram
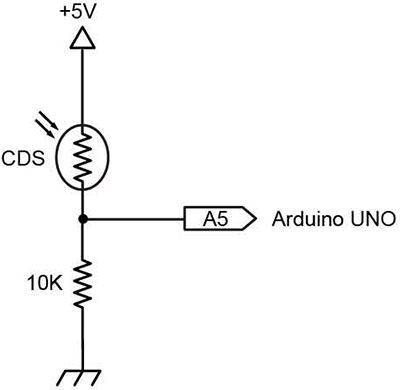
Schematic Diagram
Replace the tact switch and CdS cell from the previous exercise, “Arduino+Switch.” The CdS cell is non-polarized.
Turning on an LED based on light detection
1. Preparing the Sketch
Create a blank sketch, copy and paste the code below, and then save the sketch.
// LED control using a CdS cell December 2017 nakayasu

const int analogInPin = 5; // Analog input pin to which the CdS is connected
int sensorValue = 0;

void setup()
{
  pinMode(3, OUTPUT); // Set D3 to output mode
}

void loop()
{
  sensorValue = analogRead(analogInPin); // 10-bit input, 0–1023

  if(sensorValue > 600) { // Values range from 0 to 1023; the higher the value, the higher the sensor sensitivity (the lower the light sensitivity)
    digitalWrite(3, LOW); // Turn off the LED
  } else {
    digitalWrite(3, HIGH); // Turn on the LED
  }
}
Download Sketch Data
Arduino_4-3_LedByCdS_Arduino.zip (Currently unavailable)
2. Functionality Check
Compile and program the device.
When you hold your hand over the CdS to block the light, the LED lights up.
If the room is bright, you must block the light around the CdS cell for it to respond.
To increase the sensitivity, increase the value in line 15 of the sketch.
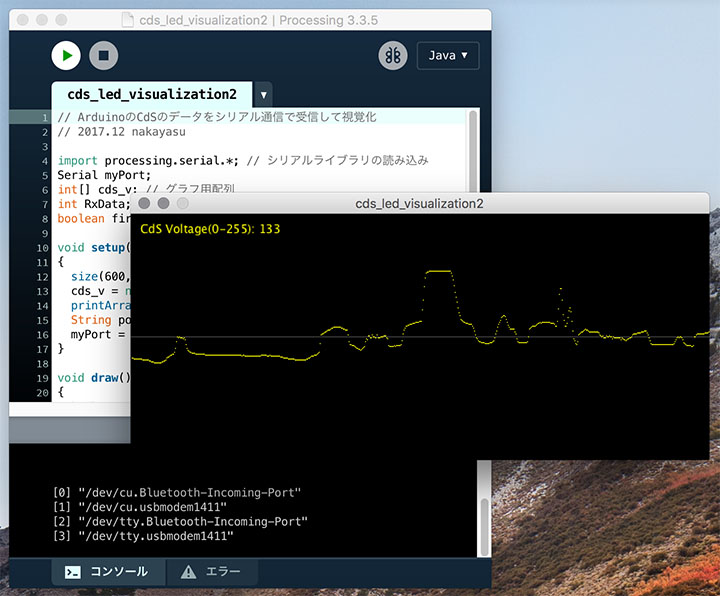
Visualizing Voltage Changes in CdS Using Processing
Send the analog value from the CdS to Processing via serial communication and visualize it as a graph.
Please note that you will be using both Arduino and Processing programs simultaneously.
1. Preparing the Arduino Sketch
Create a new sketch, copy and paste the code below, and save the sketch.
// Visualizing voltage changes in a CdS cell using Processing (Arduino side)
// December 2017, nakayasu

const int analogInPin = 5; // Analog input pin to which the CdS is connected
const int ledPin = 3; // Pin to which the LED is connected
int sensorValue; // For sensor values
int outputValue; // For transmission data

void setup()
{
  Serial.begin(9600);
  pinMode(3, OUTPUT);
}

void loop()
{
    sensorValue = analogRead(analogInPin); // 10-bit input (0–1023)
    if(sensorValue > 512) digitalWrite(ledPin, LOW); else digitalWrite(ledPin, HIGH); // Turn LED on/off based on threshold
    outputValue = map(sensorValue, 0, 1023, 0, 255); // Convert 10-bit to 8-bit (0–255) for serial communication
    Serial.write(outputValue); // Send sensor value via serial
}
Download Sketch Data
Arduino_4-4_CdSGraph_Arduino.zip (Currently unavailable)
② Uploading the Arduino Sketch
Compile and upload the sketch. Serial communication does not start when the program is uploaded to the Arduino. Serial communication begins only after you launch Processing.
3. Preparing the Processing sketch
Create a new sketch, copy and paste the code below, and then save the sketch.
// Visualizing voltage changes in a CdS cell using Processing (Processing side)
// December 2017, nakayasu

import processing.serial.*; // Load the serial library
Serial myPort; // Serial port
int[] cdsData; // Array for the graph
int RxData; // Variable for received data

void setup()
{
  size(600, 255);
  cdsData = new int[width]; // Initialize an array with the window width
  printArray(Serial.list()); // Display the serial devices on the console
  String portName = Serial.list()[3]; // Serial device number
  myPort = new Serial(this, portName, 9600);
}

void draw()
{
  background(0); // Update background
  stroke(60); // Center line color
  line(0, 127, width, 127); // Draw center line
  fill(255, 255, 0); // Text color
  text("CdS Voltage(0-255): " + RxData, 10, 20); // Draw text

  stroke(255, 255, 0); // Point color
  for(int i=1; i < width; i++) cdsData[i-1] = cdsData[i]; // Shift the array
  cdsData[width-1] = RxData; // Assign the received data to the end of the array
  for(int i=1; i < width; i++) point(i, -1*cdsData[i]+255); // Draw the array (graph)
}

void serialEvent(Serial myPort) {
  RxData = myPort.read(); // Receive serial data
}
Download Sketch Data
Arduino_4-4_CdSGraph_Processing.zip (Currently unavailable)
④ Running a Processing Sketch
When you hold your hand over the CdS cell, you can see that the voltage value changes depending on the light intensity.
By setting a threshold, you can create an ON/OFF program.
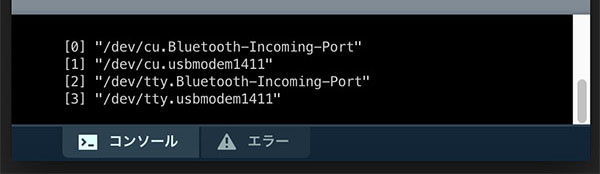
Depending on your environment, you may need to change the serial device number (the number in []) on line 15. You can check the serial device number in the Processing console window, as shown in the figure below. The entry labeled /dev/tty.usbmodem**** corresponds to the Arduino.
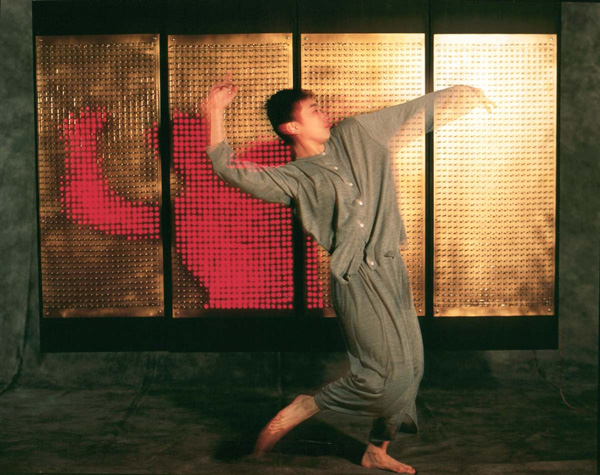
Rayography
Hiroyuki Moriwaki’s “Rayography” (see image below) is a media art installation featuring numerous light sensors and LED circuits. When the light sensors detect movement, the shadowed areas light up. This work transforms the traces of human presence—shadows—into images of light. (Artist interview)
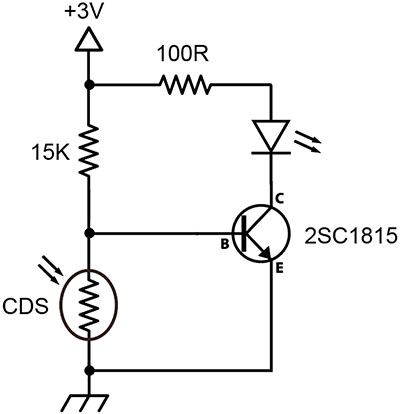
A circuit combining a CdS cell and an LED can be easily constructed using a transistor (see figure below). Such circuits are used in “rayography.” Security lights operate on the same principle. In the case of security lights, a pyroelectric sensor is also used to detect human movement.